Calculate Churn the Right Way: See how monthly and annual churn impacts subscription revenue
Calculating churn rates for your eCommerce subscription business may seem straightforward on the surface, but should you be looking at monthly churn, annual churn — or both? Or does measuring retention make more sense for your business?
And… When exactly does “churn” go into effect when subscribers can cancel anytime?
If the end goal is to have a clear snapshot of your business performance, these are questions you don’t want to get wrong.
Fortunately, Eric Andrews, Ordergroove’s Director of Growth, has the answers and the templates you need to accurately calculate a range of churn rate variations to glean valuable insights about the future of your subscription business.
Whether you’re just here for the video or prefer to read along, feel free to grab your own copy of Eric’s churn rate calculator template before we dive in.
First things first —
What is churn rate, and when should you use it?
By definition, churn only applies to businesses selling products or services through a subscription model. But that can range from eCommerce and retail, to things like insurance, telecom, software as a service (SaaS), or even gym memberships — as long as customers sign up to be charged regularly to keep receiving the product or service.
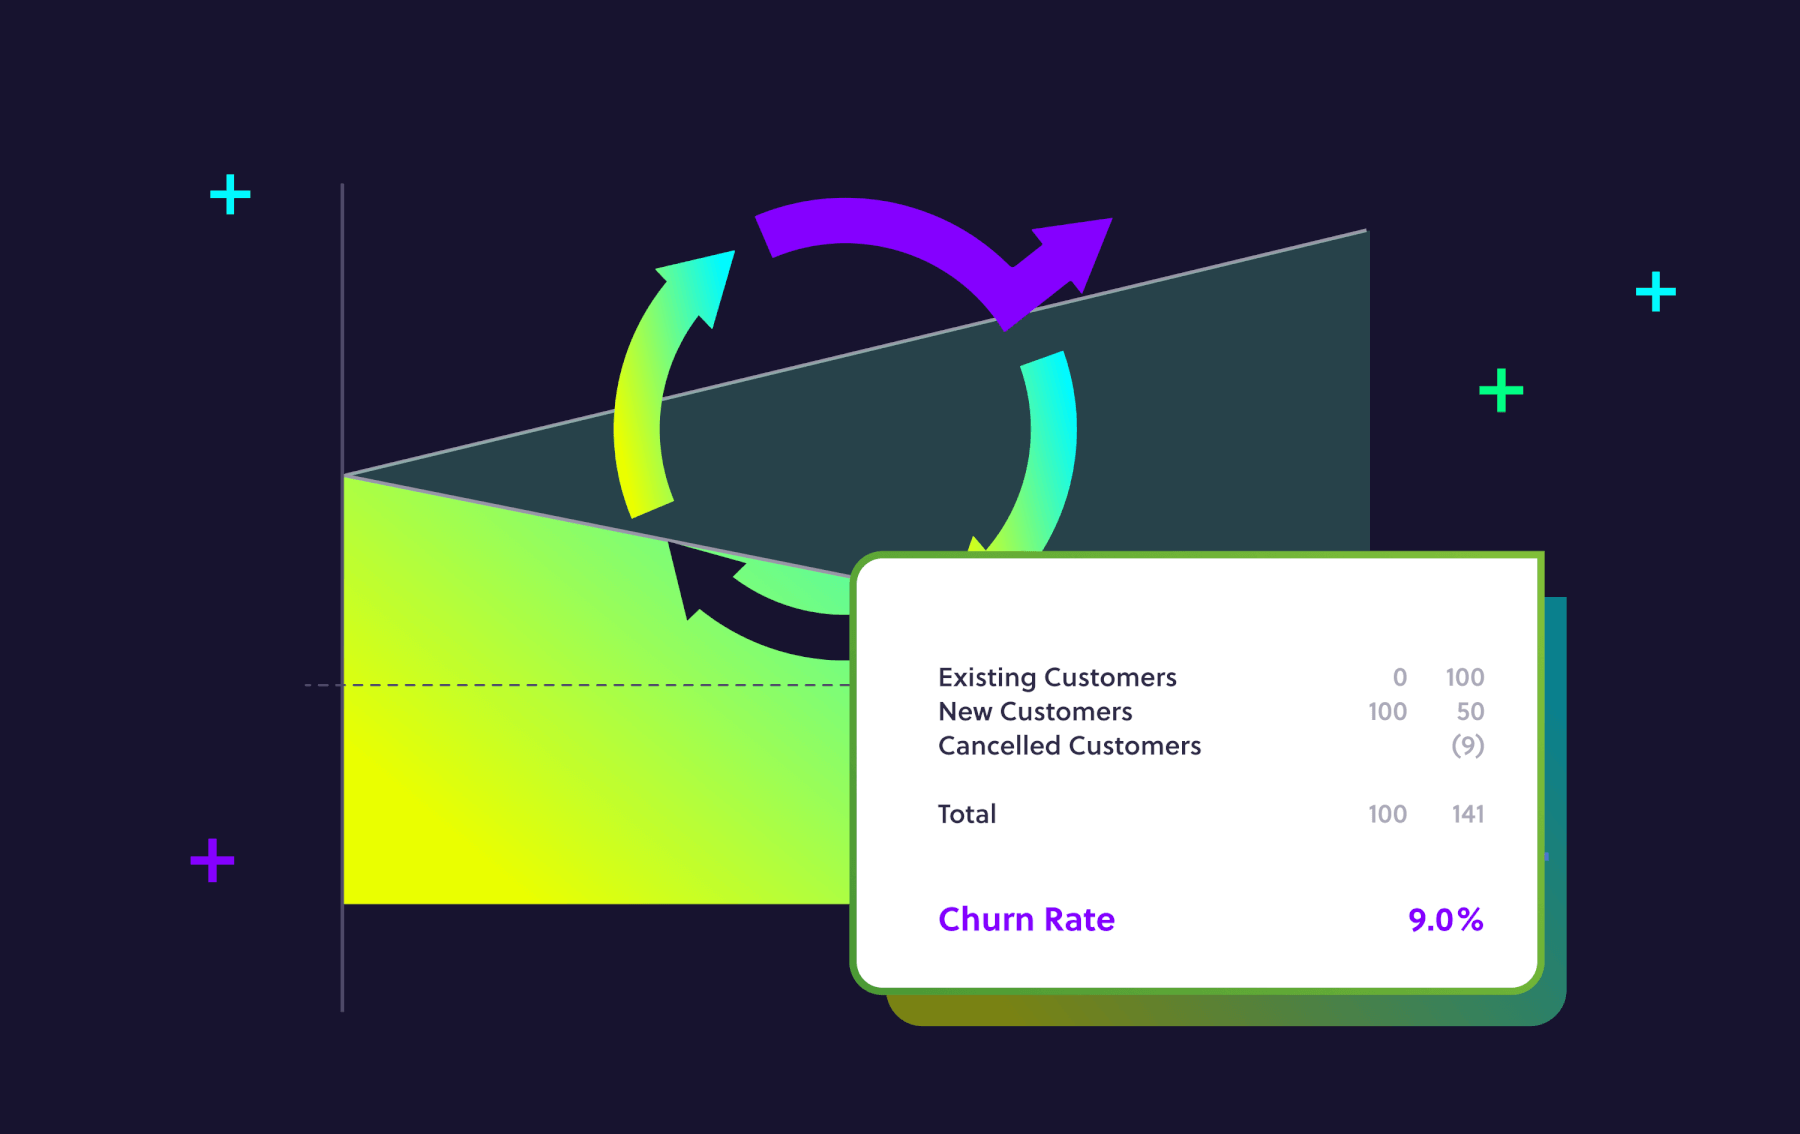
So, churn rate is the percentage of subscribers who cancel their subscription in a specific period of time. 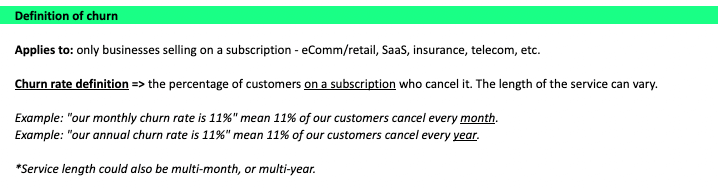
And because the length of subscription order cycles can vary from business to business, the time period you choose to measure can make or break the accuracy and relevance of your churn rate findings — and any other figures that factor in your churn rate, like CAC payback period calculations.
Let’s say your monthly churn rate is 11%. That means that 11% of your customers cancel every month. But you could also have an annual churn rate of 11%, which would mean that 11% of your customers cancel per year.
As you can see, the same churn rate can have significantly different implications for your business depending on the time period you measured.
But the length of your subscription order cycle matters, too. Whether your subscribers are charged every 30 days or every 90 days — or even every two to four years, which is common with B2B SaaS — a hypothetical churn rate of 11% doesn’t mean much without specifying the time period.

Download our free Churn Rate Calculator Template!
Learn how to accurately calculate monthly and annual churn rates to glean valuable insights about the future of your subscription business.
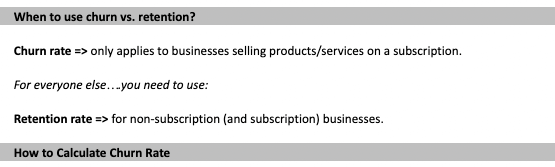
Churn rate vs. retention rate: What’s the difference?
We’ve established that churn rate only applies to businesses selling products or services through a subscription model, and it measures the percentage of subscribers who cancel within a given time period.
But how is that different from retention?
Retention rate is a relevant metric for both non-subscription and subscription businesses, and it measures how many customers keep buying from you within a given time period.
You could say that churn rate and retention rate are two opposites when it comes to the customer lifecycle — and that churn is inversely related to retention rate. The higher the churn, the lower the retention, and vice versa.
High churn and low retention rates tell a merchant that subscribers or customers are taking their business elsewhere fairly quickly, which could indicate an issue with the product or service being offered — or there’s not enough value in the merchant’s offering to keep them around.
On the other hand, low churn rates and high retention rates tell a merchant that subscribers or customers are happy enough with the product or service offered to continue purchasing for longer periods of time.
While churn measures missed opportunities for recurring revenue, monitoring retention helps businesses uncover the correlation between the actions they take (think: marketing, launching new products, or even internal operations) and how their existing customers respond — like spending more, buying less frequently, or not at all.
Using the subscription churn rate calculator template
Now we’re ready to walk through the two most common churn rate calculation scenarios.
Download our free Churn Rate Calculator Template!
Learn how to accurately calculate monthly and annual churn rates to glean valuable insights about the future of your subscription business.
How to calculate monthly churn rate
Let’s say we’re running a subscription business that charges every 30 days. We had 100 subscribers last month, and now we have 141 — so what’s our monthly churn rate?
We need a few more pieces of information to figure it out:
- The number of new subscribers we got in a month
- And the number of subscribers who canceled in a month
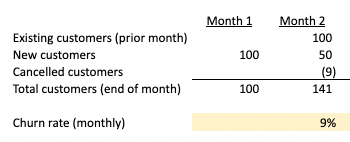
Looking at the example in the churn rate calculator template, you can see we brought on 100 subscribers in Month 1, and they all rolled forward into the next month — where we brought on 50 more new subscribers, and also had nine cancellations — leaving us with 141 subscribers at the end of Month 2.
So, now what’s our churn rate? We know that nine customers churned, but we still need to answer nine out of how many.
The most common churn rate calculation mistake
One of the most common mistakes is taking the number of canceled subscribers and dividing it by the number of total subscribers in the same month. That would leave us with a 6% churn rate in our example — but that’s incorrect.
If someone signs up for our subscriptions today and then cancels it, the churn doesn’t go into effect until they’re up for renewal the following month.
That means that the nine cancellations from Month 2 are out of the 100 subscribers we had in Month 1 — not out of the total number of subscribers from the same month. So, the monthly churn rate for Month 2 is 9%.
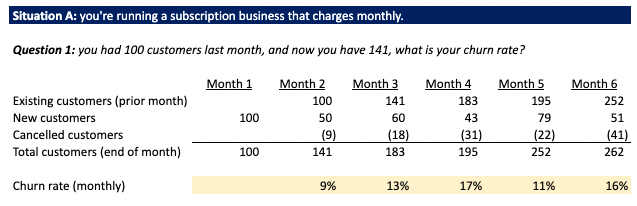
And you can see what it looks like if we copy this formula forward with some more hypothetical numbers to track monthly churn rate over time.
How to calculate annual churn rate
Now let’s say we’re running a subscription business that charges annually. We had 53 subscribers last year, and now we have 66 — so what’s our annual churn rate?
Again, we need some more info to do our calculation:
- The number of new subscribers we got in a year
- And the number of subscribers who canceled in a year
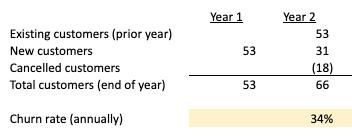
In our example, you can see that the 53 new subscribers we brought on in Year 1 rolled forward into Year 2, where we brought on 31 new subscribers and had 18 cancellations.
Just like with monthly churn rate, we need to divide the 18 canceled subscribers by the total number of subscribers in the prior year — leaving us with a 35% annual churn rate for Year 2.
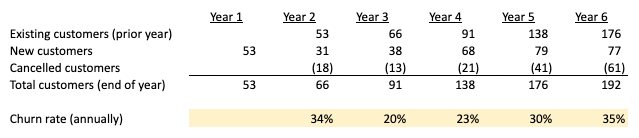
And if you copy this forward with more of our hypothetical numbers, you can see that the annual churn rate ranges from 20% to 35%.
Now imagine that you offer both monthly and annual subscriptions. You’d want to analyze churn rates for both to see which is performing better and identify when or why the drop-off is occurring.
You might think the annual subscriptions have ridiculously high churn rates compared to your monthly subscription offering — and conclude that your monthly subscriptions are performing better.
But again, you need more information before you can decide.
Because you’re not only comparing apples to oranges by looking at monthly and annual metrics side by side — but you also need to figure out what churn in general means for your bottom line.
Quantifying the impact of churn rate on subscription revenue
So, what does churn actually tell us about the future of your subscription business — and what does a good churn rate look like?
The answer varies from business to business because churn rates tend to be industry-specific — some product types are naturally “stickier” and lead to lower churn, while other products last longer and are only purchased right when customers need them, leading to higher churn. That said, a 5% monthly churn rate is considered the average for subscription businesses.
Aside from how you measure up against other merchants in your industry, churn rates can tell you vital information about the short and long-term performance of your subscriptions — and the insights can be surprising.
Let’s say your churn rates are trending on the high side, but your overall revenue is still growing rapidly. Does your churn rate really matter?
The answer is yes.
Because low churn rates mean subscribers are spending money with you over longer periods of time, which adds up to higher customer lifetime value (LTV) — and offsets the amount you spend to acquire more customers — improving ROI and efficiency for your subscriptions, so your business can grow profitably.
But to quantify the exact impact of your churn rate, you need to know one more formula.
Download our free Churn Rate Calculator Template!
Learn how to accurately calculate monthly and annual churn rates to glean valuable insights about the future of your subscription business.
How to calculate the average subscriber lifetime based on churn rate
The churn <> lifetime formula is worth memorizing because it’s the key to uncovering the average lifetime of your subscribers — and therein lies the answer to what churn rates really mean for your business.
Let’s say our monthly churn rate is 25%. We can use the churn <> lifetime formula (one divided by the churn rate) to arrive at our average subscriber lifetime.
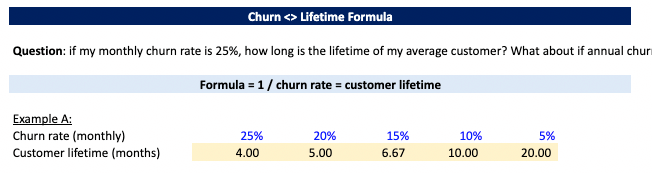
In the example from our calculator template, you can see that one divided by a monthly churn rate of 25% means the average subscriber lifetime is four months.
But you can also see that as churn rate improves, the average subscriber lifetime goes with it.
Reducing monthly churn from 25% to 20% extends the subscriber lifetime from four months to five. Another 5% churn rate reduction grows the average subscriber lifetime to almost seven months.
When you get to a 10% monthly churn rate, the average subscriber has a 10-month lifetime. And if you can get to a 5% monthly churn rate, it means subscribers stick around for 20 months on average.
So, yes. Churn rate really does matter. It’s a leading indicator of the average subscriber lifetime — and by extension, subscriber LTV.
Converting the churn <> lifetime formula annually and monthly
Finally, let’s look at an example of annual churn <> lifetime calculations.
The formula is exactly the same. If you have a 40% annual churn rate, you divide one by 40 to get an average subscriber lifetime of two and a half years.
But if you’re evaluating the performance of annual subscriptions against monthly subscriptions, you’ll need to multiply the average subscriber lifetime by 12 for a fair comparison — so, a 40% annual churn rate translates to an average subscriber lifetime of 30 months.
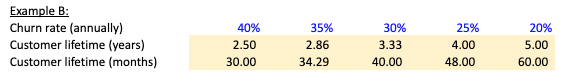
And looking at a range of hypothetical annual churn rates, you can see the same relationship between churn and subscriber lifetime that we saw on a monthly basis. When churn rate declines, subscriber lifetime goes up.
And no matter the frequency and timing of your subscription order cycle, churn is a leading indicator of average subscriber lifetime — and ultimately, LTV.
Churn is a missed opportunity for recurring revenue
Think of churn rate as one of the most important levers in the bigger financial picture of your subscription offering.
If you can optimize your churn rate, it will increase your revenue, decrease your marketing costs, and increase the profitability of your subscriptions. So, it’s for good reason that leading brands like Whisker and Furtuna Skin have partnered with Ordergroove to reduce their churn rates by 36% and 50%, respectively.
It’s a powerful metric to focus on if you’re looking to scale your business — and with Eric’s subscription churn rate calculator template, you can be sure of your findings.
If you’re a fast-growing eCommerce/retail business with $1M+ in subscription revenue and want to customize your subscription experience, reduce churn, or migrate off a homegrown system to lower your technology costs, book a demo with us and you’ll be eligible for 10% off your annual contract value by mentioning Eric or the calculator template.